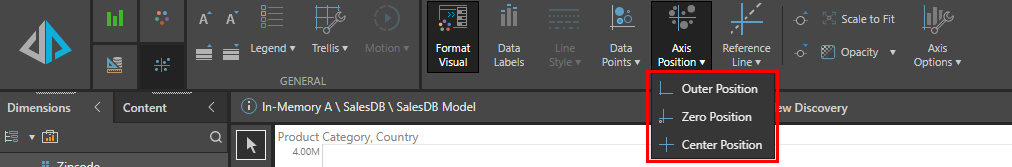
The Axis Position dropdown list is used to set the physical position of the x- and y-axes when working with plotted charts and radar charts. There are three axis positions: outer position, zero position, and center position.
Axis Positions
- Outer Position: Both the x- and y-axes are positioned along the outside of the chart, with minimum scale values starting at the values automatically determined by Pyramid (unless a custom scale limit is configured from the Axes Options dialog).
- Zero Position: If the minimum scale limits fall below 0, selecting this option will position the x-axis in such a way that it intersects with the 0 point on the y-axis.
- Center Position: The x-axis is positioned horizontally across the middle of the canvas and the y-axis vertically down the middle of the canvas, so that both axes intersect in the center of the chart.
Formatting Panel
Axis position can be changed from the Settings tab in the Formatting Panel:
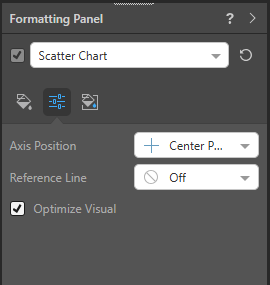
Axis Position Dropdown List
The Axis Position dropdown list can also be accessed from the Component ribbon:
Examples
In this example, the following data set is plotted in a scatter chart:
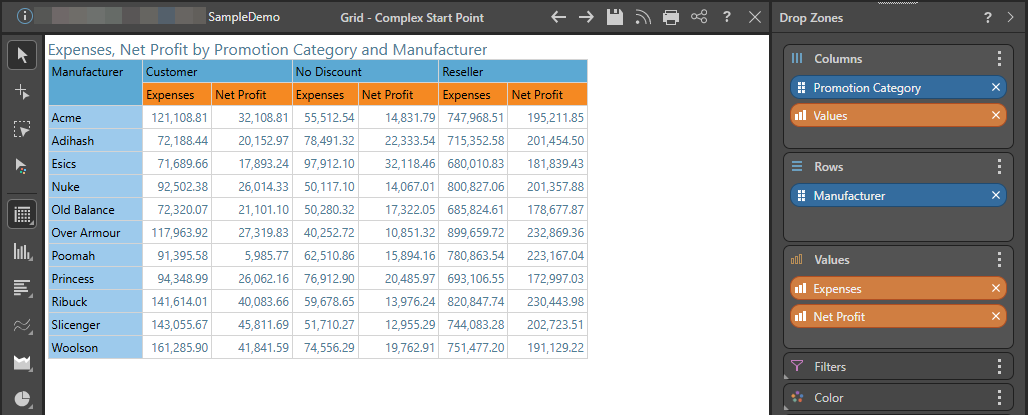
Scatter Plot
Important: In addition to the axis position, you can also add a Reference Line to your chart. For more information, and examples that show both the different Axis positions and Reference Lines, see Reference Line.
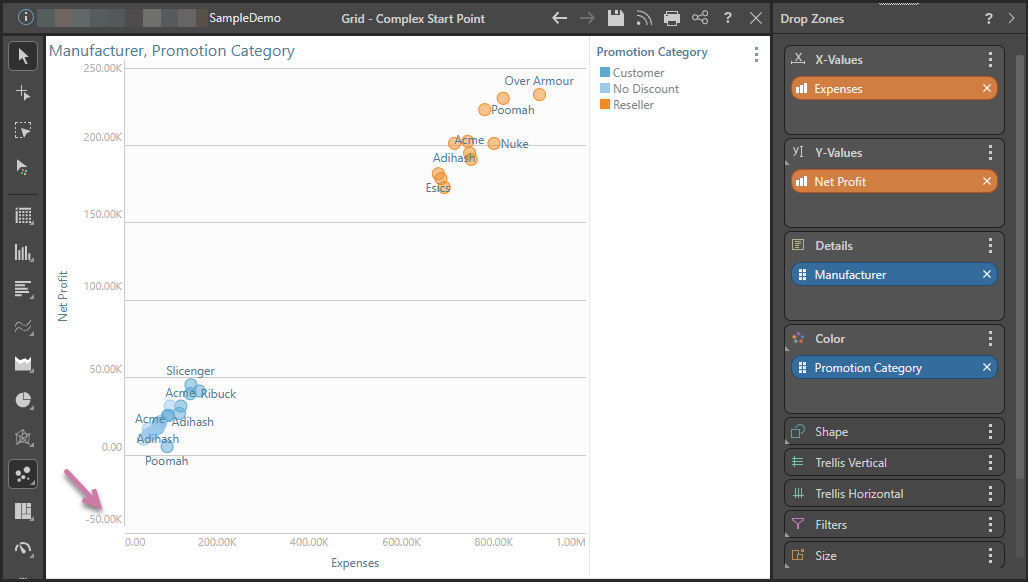
Outer Position
Here, Outer Position was selected on the Component ribbon or Formatting panel, so that the x-axis intersects with the smallest scale limit on the y-axis, which is -50K (purple arrow below):
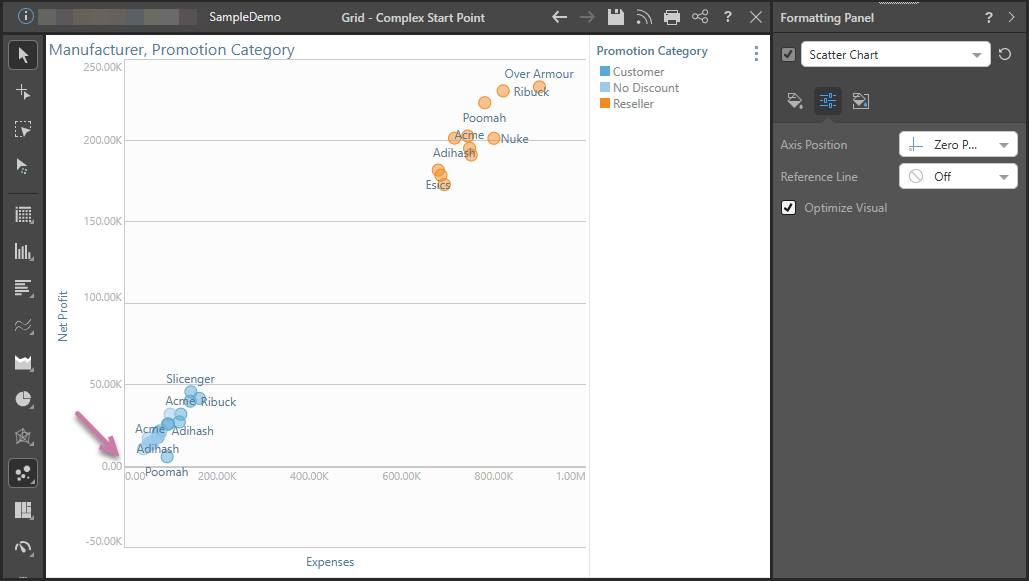
Zero Position
Here the Zero Position was chosen; both the x- and y-axes are positioned so that they intersect at 0 (purple arrow below).
If neither axis displays a minimum scale value of less than 0, the zero position will be the same as the outer position.
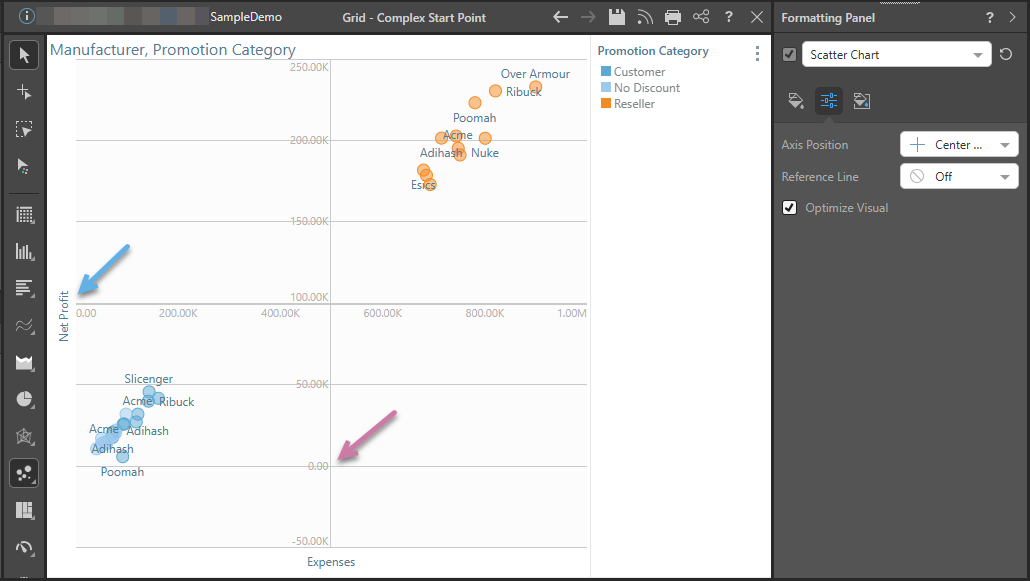
Center Position
Here, Center Position was selected; both axes intersect in the center of the chart, splitting it into four quarters. As usual, the x-axis (blue arrow) is horizontal, and the y-axis (purple arrow) is vertical).